Stocks
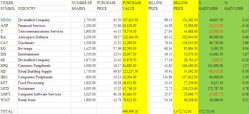
In this assignment we had to create an excel spreadsheet listing 15 major stocks, and all the statistics that go along with it. we also had to color coat certain sections of data and answer 5 questions based on the data. To do well in this assignment i had to understand how to format charts and color coat things along with knowing how to use a 1000's separator. In this assignment I learned how to use the 1000's separator accessory. I think I did well in this assignment and I would not change anything.
Formula 22
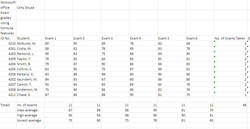
in this assignment we had to create an excel spreadsheet listing the quiz scores and averages for all the quizzes. we also had to answer five questions based on the information in the chart. to do well in this assignment we had to know how to basically do formulas. in this assignment i did not learn anything new. i think i did well in this assignment.
Line chart group project
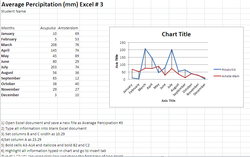
In this assignment we had to work in a group to figure out how to create and list the data and information that corresponds with a line chart. Also we had to create a PowerPoint listing how to use a line chart and the appropriate situation to use a line chart. to do well in this assignment we had to work well as a group and participate. I think i did well as an overall group performance but i think i did poorly individual performance.
Yacht Mortgage
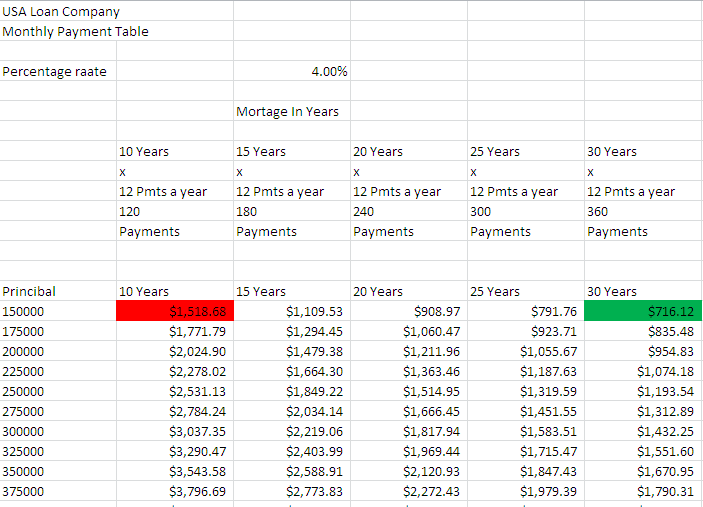
In this assignment we had to list the prices of yacht mortgages during different year spans, and label the 10 year and 30 year price. also we had to list prices for 15 years 20 years and 25 years. to do well in this assignment you had to simply follow directions and do formulas correctly. i think i did well in this assignment.
